Emacs 调试手段
调自己的程序时
这种情况一般使用打印调试, 效率高一些
打印调试
高效的 eval 新写的函数
 1
 2
 3
 4
 5
 6
 7
 8
 9
10
11
12
13
14
15
16
17
18
19
20
21
22
23
24
25
26
27
28
29
30
31
32
33
34
35
|
(defun my/eval-current-elisp-func (&optional run)
  " eval-last-sexp 当前光标处的function
根据run 来决定是否要运行"
  (interactive)
  (let* ((current-pos (point)) func-start-pos func-end-pos fun-name)
    (when (string= major-mode "emacs-lisp-mode")
      (save-excursion
        (re-search-backward "^\\s-*(defun .*" nil t)
        (setq func-start-pos (point))
        ;; (message "func-start-pos : %d" func-start-pos)
        (end-of-defun)
        (setq func-end-pos (point))
        ;; (message "func-end-pos : %d" func-end-pos)
      )
      (when (and (>= current-pos func-start-pos) (< current-pos func-end-pos))
                 (re-search-backward "^\\s-*(defun .*" nil t)
                 (evil-jump-item)
                 (eval-last-sexp nil)   ;; 不把执行的结果插入到当前buffer 中
                 (goto-char current-pos)
                 (when run
                   (setq fun-name (format "(%s)" (lisp-current-defun-name)))
                   (eval (read fun-name)))))))

(defun my/eval-current-elisp-func-only ()
  " eval-last-sexp 当前光标处的function "
  (interactive)
  (my/eval-current-elisp-func))

(defun my/eval-current-elisp-func-and-run ()
  " eval-last-sexp 当前光标处的function 并运行"
  (interactive)
  (my/eval-current-elisp-func t))

(define-key emacs-lisp-mode-map (kbd "C-c e") #'my/eval-current-elisp-func-only)
(define-key emacs-lisp-mode-map (kbd "C-c r") #'my/eval-current-elisp-func-and-run)
|
这样可以在新写的或者有改动的函数内C-e 即可eval 当前函数, C-r 就可以eval 并运行当前函数
不再需要把光标移动到函数最后的括号再C-x C-e 或者直接 eval-buffer ( 速度太慢了 )
SPC-o-f (make-frame)
新开一个 frame 然后把这个frame 拖到另一块屏幕上, 并切换到 message 窗口这样调试起来很方便
改完代码运行后 C-h e 就能跳到 message 的最底部了
调别人的程序时
当遇到不可解决的错误时
比如:
- M-x: toggle-debug-on-error 把 debug-on-error 打开
- 当出现错误时, 错误的回溯信息会输出到
*Backtrace*
- 分析
*Backtrace*
如果出卡死, 需要通过 C-g 才能恢复
- M-x: toggle-debug-on-quit 把 debug-on-quit 打开
- 当出现卡死时 按C-g
- 分析
*Backtrace*
😠 注意: 当出现C-g 都不能恢复时, 一般是C 代码层面的问题 需要借助emacs 源码和 gdb 来调试
这种情况一般是要自己编译的emacs 才能调
然后 r 运行emacs
使用 edebug-defun 来调试
光标移动到需要调试的函数上 运行 edebug-defun
这样当运行到该函数时会自动停在函数开始的地方
进入edebug-mode 后需要记住的一些小技巧
-
H 运行到光标处, 但是好像有点问题, 实际运行到的地方是光标上一步的地方( 即光标处的上一步还未运行 )
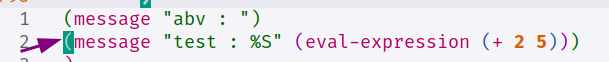
如在箭头处按H , 实际上还没有运行 message abv 需要按一下n 才能打钱 abv